|
PATTERN CHASER
Audit Analytics for Internal Audit in Financial Services
|
|
|
A sample of 25 found nothing
The million-row version found all 12. One ledger. Twelve things hidden inside it. And the difference between sampling a population and reading it.
|
|
Hey Reader 👋
A company makes a million payments in a year. You are going to test twenty-five of them.
That is not laziness. It is the method. Draw a representative sample, test it properly, conclude on the population. It is in every audit methodology ever written.
So I put the method to a real test. I built a ledger of a million payments and hid twelve things inside it: duplicates, a payment approved by someone who had already left, a vendor paid minutes after it was created, a run of amounts sitting just under the sign-off limit, one payment of three and a half million pounds filed under printing and marketing.
The ledger is synthetic, built to a fixed seed so anyone can rebuild it and get the same twelve. No client data goes near this.
Then I did what audit does. Drew twenty-five rows at random and checked them. Drew another twenty-five. Two thousand times over.
The average number of the twelve that a sample of twenty-five caught was 0.001. Ninety-nine point nine per cent of the samples caught nothing at all.
Then I stopped sampling and read all million rows. Every one of the twelve fell out.
In today’s issue:
| ↳ |
Why testing twenty-five rows out of a million is the right tool for the wrong question |
|
| ↳ |
A full-population sweep shown in full: the twelve things a sample never sees and the joins that surface them |
|
| ↳ |
What changes for coverage, cost and the name on the opinion when you read all of it |
|
|
|
|
|
THE APPROACH
You don’t need a magic model. You need to look at everything.
A sample is built to answer one question: roughly what is the error rate across this population, give or take a confidence interval. For that job it is the right tool and full-population testing does not replace it.
But a sample was never built to find twelve specific things hiding in a million. The rarer the thing, the more certain a sample is to walk straight past it. Twenty-five rows out of a million is not thin. It is a rounding error.
Reading everything is not one clever algorithm either. It is two plain moves, done in order.
Profile first. Learn what normal looks like across the whole ledger. What most payments cost, which vendors take most of the volume, which days the payment run fires, what a registered bank account should be. You cannot spot the odd one until you know the shape of the ordinary.
Then run targeted tests. Not a single black box scoring everything at once. A handful of sharp, risk-based filters and joins, each one asking a specific question a real fraud or error would answer wrongly. Group the duplicates. Join the approver to the leaver list. Compare the paid-to account with the registered one. Twelve tests for twelve kinds of problem, run across all million rows at once.
|
|
|
|
THE RESULTS
Twelve things, four kinds, all of them read off the whole ledger
Here is every one of them and the move that surfaced it.
|
|
A · The duplicates (4)
A duplicate is not one thing. It is four shapes of the same mistake.
| ↳ |
Exact. Same invoice, same vendor, same amount, paid twice days apart. £4,525, out the door twice. |
|
| ↳ |
Fuzzy. Same invoice, but the vendor name is spelt two ways and one digit of the bank account is transposed. Match on exact fields and it hides. £9,809. |
|
| ↳ |
Split. One invoice paid in full, then again as two part-payments that sum to the same total. Three rows, one bill paid twice. £5,556. |
|
| ↳ |
Cross-period. Paid in December, re-paid in January. Any test that runs one period at a time never sees both halves. £10,171. |
|
Across the whole ledger you do not score pairs of payments against each other. You group by invoice number and count. Anything paid more than once against one invoice surfaces, whatever shape it took. A sample catches, on average, none of them.
|
|
B · Who was allowed to do what (3)
Three payments that look ordinary until you join the ledger to the people behind it.
| ↳ |
A payment approved by a user who left on 30 June 2023. Their leaving date was in the HR file. Their approval rights were never switched off, so the account kept signing things off long after the person was gone. |
|
| ↳ |
A £41,750 payment where the person who raised it and the person who approved it are the same user. The segregation-of-duties limit is £25,000. One filter on requester equals approver finds it in a second. Nobody had run it. |
|
| ↳ |
A brand-new vendor, created and then paid £28,900 by the same user, minutes apart. New payee, new payment, one hand on both. You only see it if you join the vendor master to the payments and compare timestamps. |
|
None of these is a big number. Each is a join a single spreadsheet filter cannot make.
|
|
C · The four a sample is built to miss (4)
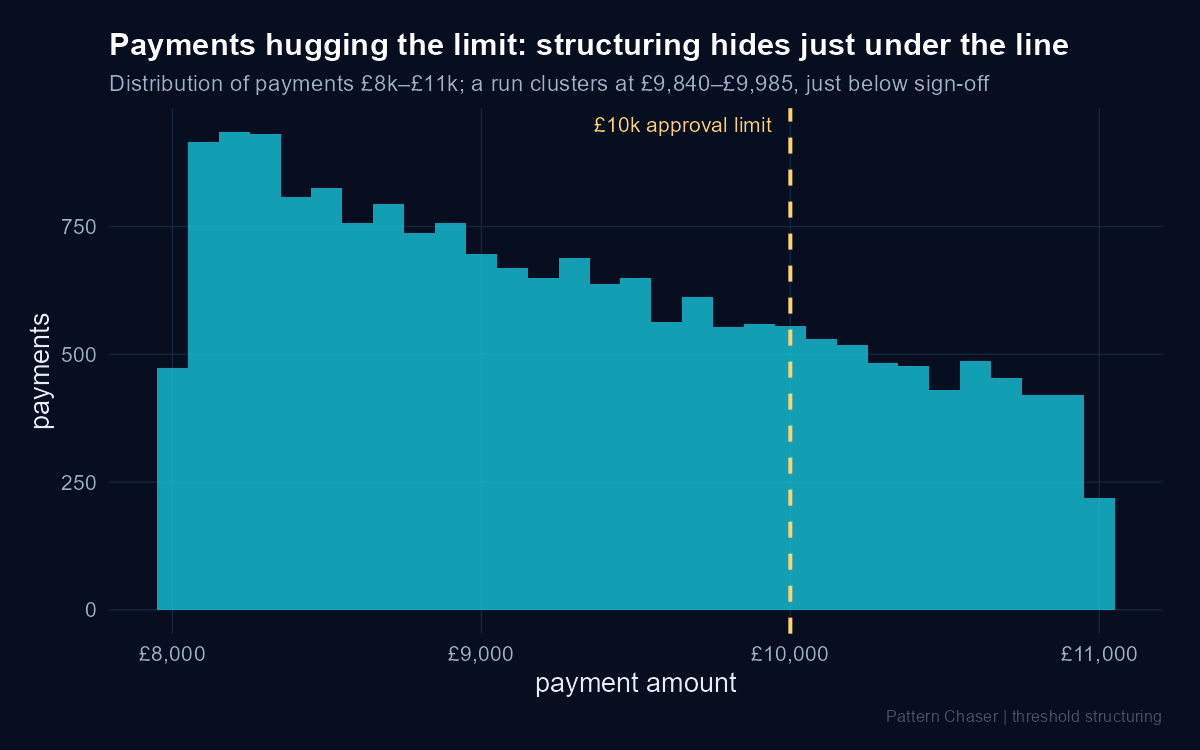
Structuring. A run of seven payments to one vendor, all between £9,840 and £9,985, sitting just under the £10,000 approval limit.
Count near-limit payments the naive way and twenty-eight vendors light up, most of them just busy. Normalise the rate against each vendor’s own volume. Ask which vendor has more near-limit payments than its size can explain. Twenty-eight collapses to one. Concentration was never the signal. Concentration beyond what volume explains was.
|
|
|
Payments £8k to £11k. A run hugs the underside of the £10,000 limit. One vendor, once you normalise for volume.
|
|
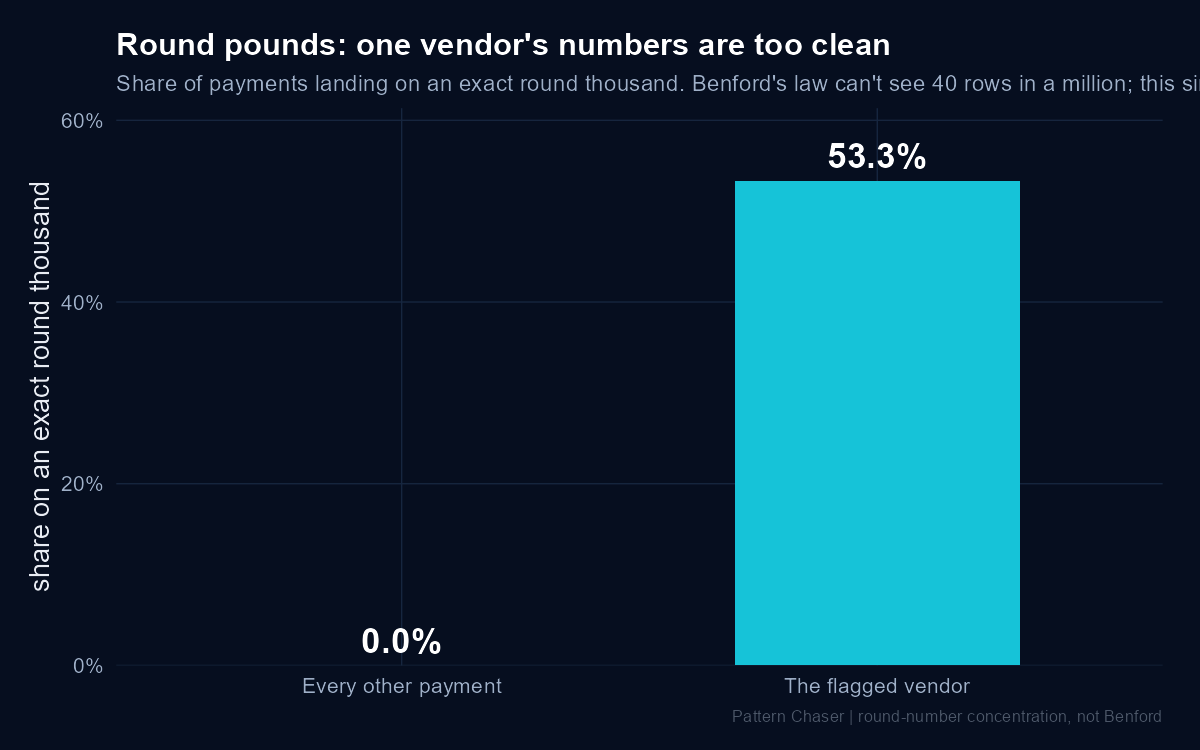
Round numbers. One vendor has 53.3% of its payments landing on an exact round thousand. Every other vendor in the ledger sits at zero.
This is the check Benford’s law cannot make. Forty fabricated round-number rows in a million never move the first-digit curve. A plain count of round pounds, per vendor, lights it up instantly.
|
|
|
Round pounds by vendor. The whole ledger rounds by accident. One vendor rounds on purpose.
|
|
Off-cycle. Seven payments dated on weekends or public holidays, when the payment run only fires on business days. Trivial to test for. Invisible to a sample of twenty-five.
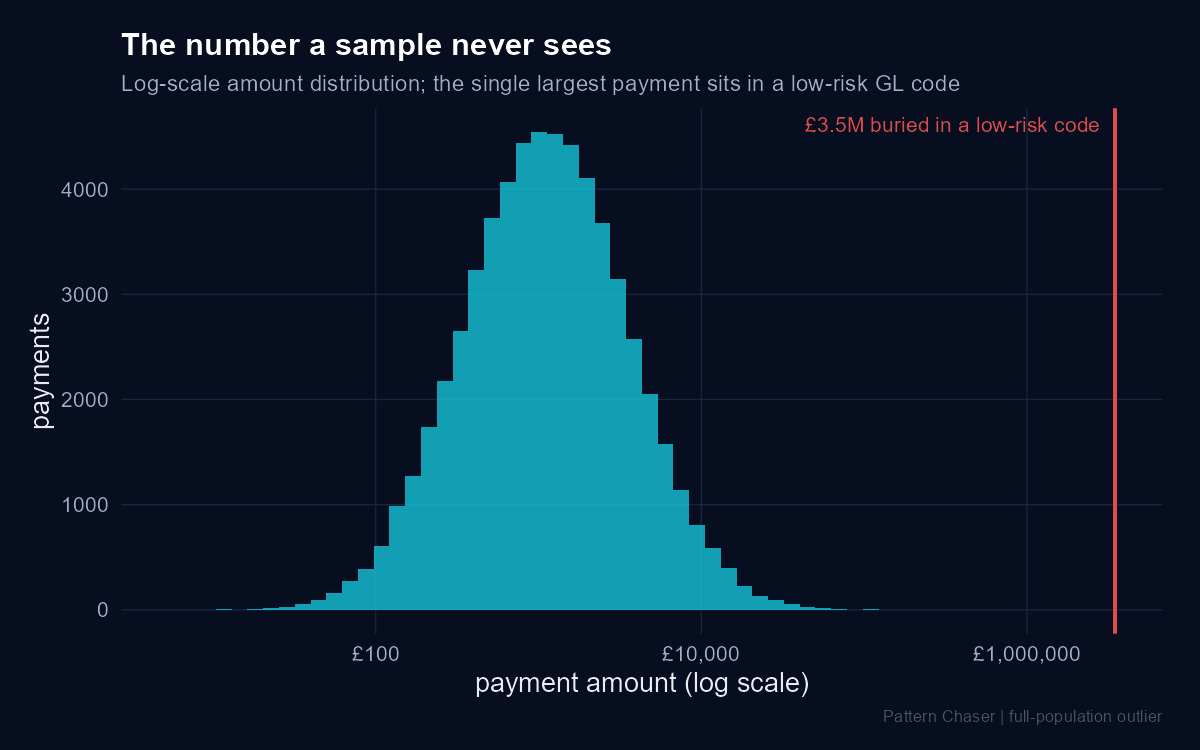
The buried outlier. One payment of £3,480,000, filed under a low-risk print and marketing code. The single largest number in the whole ledger, coded so it would never draw a second look.
A sample of twenty-five has about a one-in-forty-thousand chance of drawing it. Read the population and it sits at the top of the list every time.
|
|
|
Every payment by size. The one on the far right is the number a sample never sees.
|
|
D · The one that needs two joins to see (1)
A payment of £96,400 to a real vendor. It cleared to a bank account ending 6642. That is not the account the vendor is registered to. It is the account belonging to an employee.
The vendor is real. The invoice looks real. The money went somewhere else. No single filter finds this. You join the payment to the vendor master to see the account does not match, then join to the employee master to see whose account it does match. Two joins, one answer.
|
|
One more thing the full sweep hands you that a sample never could.
The self-approval, the vendor paid minutes after it was created and the account behind that ghost payment all trace back to the same user. A sample might have caught one of them by luck. Only reading everything lets you see they are the same story.
|
|
|
|
|
THE PAYOFF
Sampling was never the crime. Pretending it read the ledger was.
|
|
|
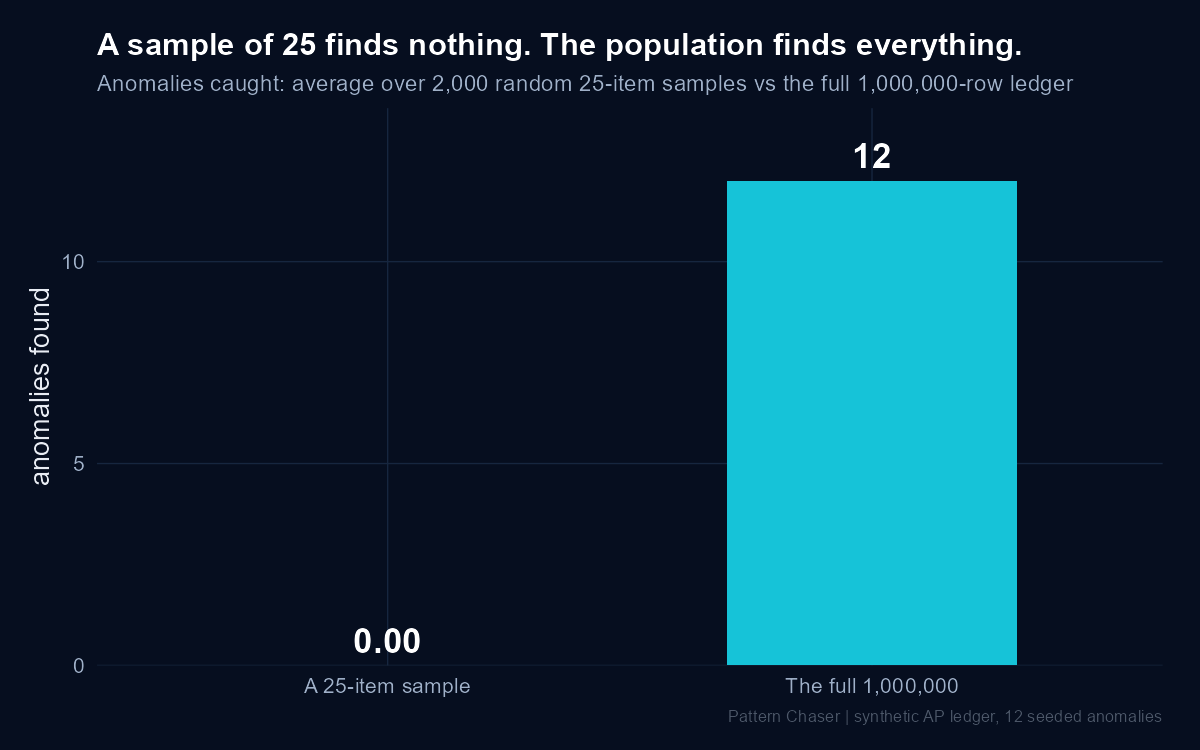
A random sample of twenty-five, run two thousand times, caught an average of 0.001 of the twelve. The full population caught all twelve.
|
|
This is not an argument against sampling. A sample is the honest answer to one question: what is the rate of error across the population, roughly, within a stated confidence. It was never meant to find twelve specific things in a million. Those are different jobs, answered by different tools.
The trouble starts when one gets signed off as the other. An opinion that says we tested a sample and found nothing, on a population it never read, is not wrong because the sample was wrong. It is wrong because it answered a question nobody asked.
|
|
|
|
WHEREVER YOU SIT
The same sweep lands differently depending on your chair. Here’s yours.
|
|
If a sample is all you have
Keep sampling for the question it answers, which is the rate. Just stop letting it stand in for the other question, which is whether the rare, specific thing is in there. Know which question you are being asked. Then say so out loud.
|
|
|
If you run the tests
None of the twelve needed a model. They needed a profile of the population and a handful of sharp joins. The ghost payment fell out of a vendor-to-employee join, not a model. Reach for the join before you reach for the black box.
|
|
|
If you own the analytics
Full-population testing is a capability you build, not a tool you buy. Profile first, then targeted risk-based tests. The concentration cluster is the tell: the naive count flagged twenty-eight vendors, the normalised one flagged the right one. The judgement is in the normalising, not the counting.
|
|
|
If you run the function
Full population changes three things. Coverage stops being an assumption and becomes a fact you can show once your extract ties back to the source. Cost moves from bodies reading lists to compute reading everything, which is cheaper and more complete at once. Assurance stops resting on “we sampled and found nothing” and starts resting on “we looked at all of it.” The one question worth asking your team: on the last opinion we signed, how much of the population did we actually read and how much did we assume?
|
|
|
A sample tells you what the rate probably is.
The population tells you what actually happened.
When someone asks did we miss anything, only one of those is an answer.
|
Every number here came from one R script run over the full million rows. The ledger is synthetic and built to a fixed seed, so the same twelve fall out every time it runs.
|
|
Before you go
Could your function actually read the whole population?
Reading everything is one of five capabilities that separate a function that samples and hopes from one that covers. The Future-Ready Auditor Scorecard shows you which of the five to build first. Two minutes, five dimensions, no audience.
|
|
|
|
|
WHAT’S ON MY RADAR
Worth your time this week.
|
🔍 THE PATTERN
Clinical trials with very low event rates. In one trial just 80 of 6,006 people hit the outcome and whole centres saw zero events. The same blind spot you have in a ledger, studied in medicine: when the thing you are looking for is rare, most of your sample sees none of it.
|
|
🧠 THE MIND
The Law of Small Numbers. The clean explanation of the bias behind every “we tested 25 and they looked fine”: the mind treats a small sample as if it faithfully represents the whole population, and it does not.
|
|
📊 THE PROOF
Full population testing versus traditional sampling. Peer-reviewed and measured: testing the whole population found problem transactions more effectively and more efficiently than sampling. Independent confirmation of the exact gap this issue shows.
|
|
🗞️ WHERE IT’S HEADING
Global Internal Audit Standards. The profession’s baseline now expects technology-enabled, evidence-driven auditing. The direction that makes full-population testing the expectation rather than the party trick.
|
|
|
|
|
SHARE
Know someone who signs opinions off a sample? Send it on.
|
|
See you next week,
Tony Abraham
Data Science & AI for Internal Audit
|
|
How did you like today’s issue?
|
|
|